---
title: OpenTelemetry internal telemetry Assets
description: This package contains dashboards that visualize the internal metrics from OpenTelemetry components. The OTel collector dashboards are compatible with...
url: https://www.elastic.co/docs/reference/integrations/otel_collector_internal_telemetry
products:
- Elastic integrations
applies_to:
- Serverless Observability projects: Generally available
- Serverless Security projects: Generally available
- Elastic Stack: Generally available since 9.3
---
# OpenTelemetry internal telemetry Assets
| | |
|-------------------------------------------------------------------------------------------------|--------------------------------|
| **Version** | 1.2.3 ([View all](#changelog)) |
| **Subscription level**[What's this?](https://www.elastic.co/subscriptions) | Basic |
| **Developed by**[What's this?](https://www.elastic.co/docs/reference/integrations/developed-by) | Elastic |
| **Minimum Kibana version(s)** | 9.3.0 |
## Overview
This package contains dashboards that visualize the internal metrics from OpenTelemetry components.
### Compatibility
The OTel collector dashboards are compatible with the metrics defined [here in the OpenTelemetry collector documentation](https://opentelemetry.io/docs/collector/internal-telemetry/). The oldest tested version of the OpenTelemetry Collector in combination with this package is v1.44.0.
Furthermore, the package also contains dashboards to visualize metrics from the `tailsamplingprocessor`. Those metrics are documented [here](https://github.com/open-telemetry/opentelemetry-collector-contrib/blob/main/processor/tailsamplingprocessor/documentation.md).
The dashboards query metrics from the `collectortelemetry` dataset. Set the resource attribute `data_stream.dataset` to `collectortelemetry` on the collector that emits internal telemetry (see below).
The dashboards expect metrics without postfixes. In particular, Prometheus-format metrics—which apply unit suffixes by default—are not supported. The dashboards are designed for metrics exported via OTLP. If you use the Prometheus exporter, set `without_type_suffix` and `without_units` to `true`. For more information, see [the upstream documentation](https://opentelemetry.io/docs/collector/internal-telemetry/#metric-views).
### How it works
The dashboards rely on field names defined in above documentations.
## What do I need to use this integration?
You need to follow [the documentation](https://opentelemetry.io/docs/collector/internal-telemetry/) of the OpenTelemetry collector to setup and send internal telemetry to your cluster.
The most important prerequisite is to define the `telemetry` section under `service` and to set `data_stream.dataset` to `collectortelemetry`.
```
service:
telemetry:
resource:
data_stream.dataset: 'collectortelemetry'
metrics:
readers:
- periodic:
exporter:
otlp:
protocol: http/protobuf
endpoint: https://backend:4318
```
With this, you'll have internal telemetry on `normal` verbosity level.
The above configuration defines an OTLP endpoint that sends internal telemetry to a target collector over an OTLP connection. This target collector then exports the internal telemetry data to Elasticsearch using the `elasticsearch` exporter. The integration subsequently reads this internal telemetry data from Elasticsearch.
For all the other config, refer to the upstream documentation.
## Screenshots
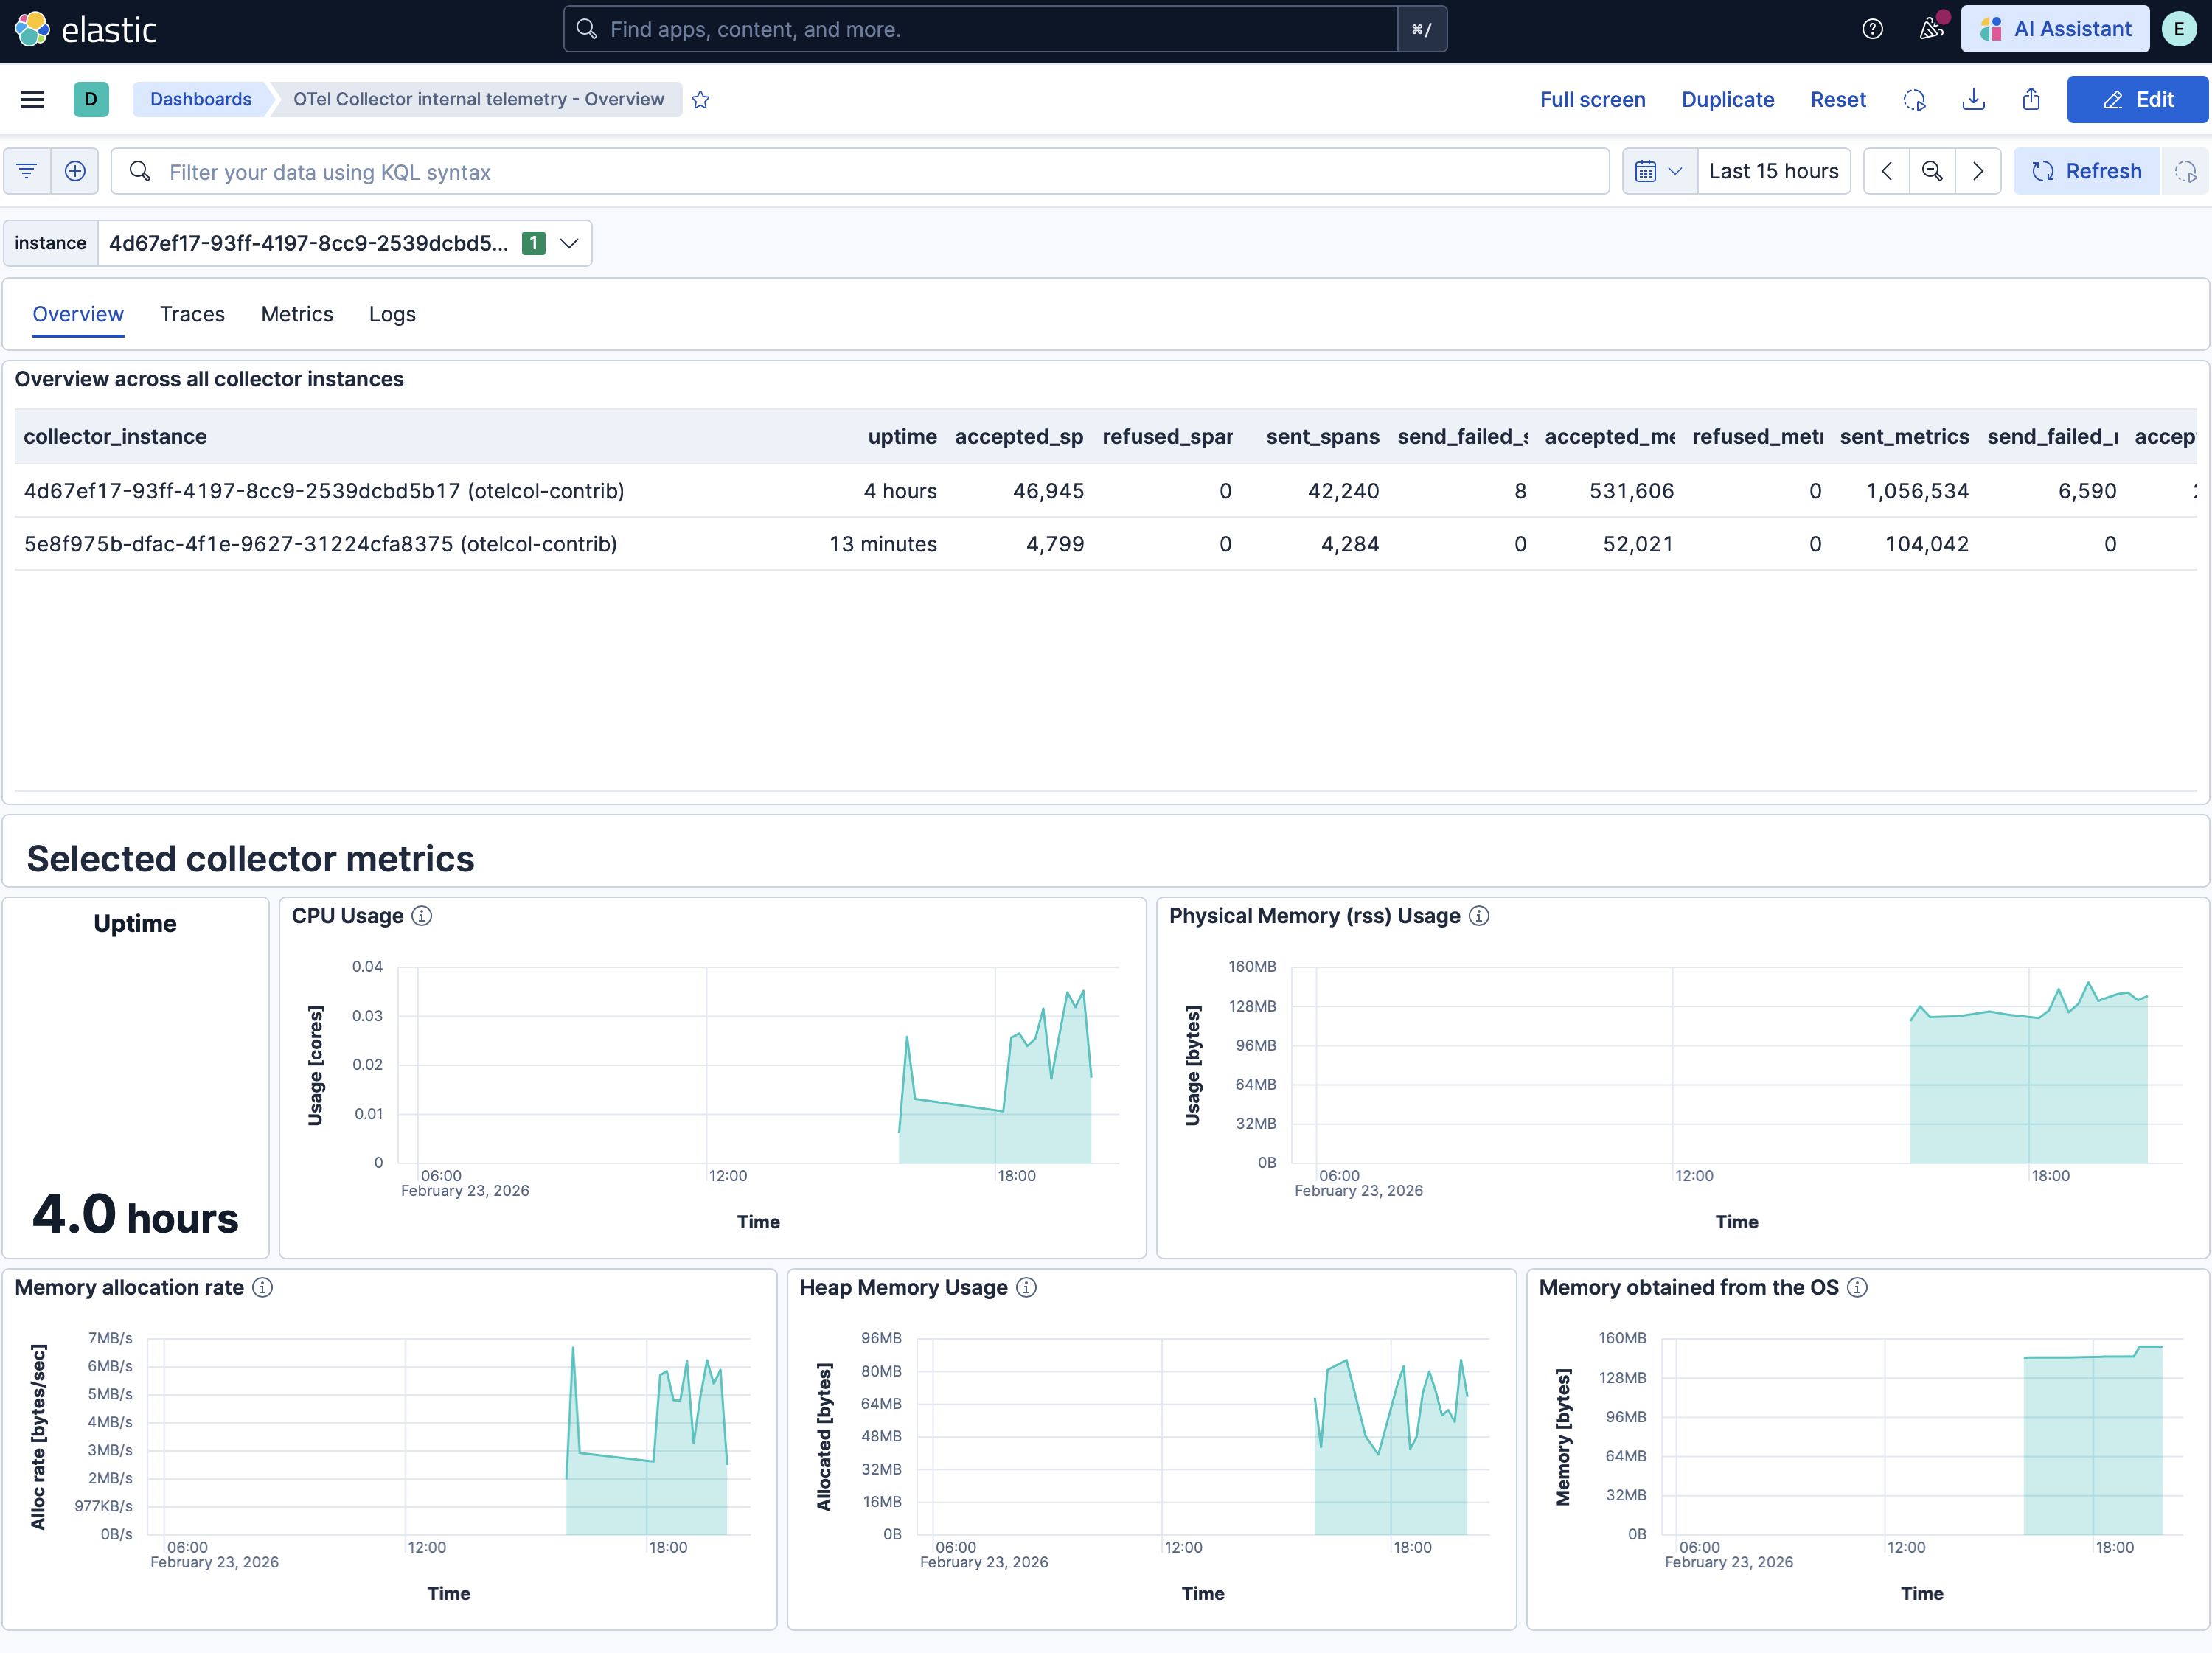
This integration includes one or more Kibana dashboards that visualizes the data collected by the integration. The screenshots below illustrate how the ingested data is displayed.
## Changelog
| Version | Details | Minimum Kibana version |
|-----------|-----------------------------------------------------------------------------------------------------------------------------------------------------------------------------------------------------------------------------------------------------|------------------------|
| **1.2.3** | **Bug fix** ([View pull request](https://github.com/elastic/integrations/pull/20887))Fix Overview dashboard ES|QL failing on unmapped collector counter metrics. | 9.3.0 |
| **1.2.2** | **Enhancement** ([View pull request](https://github.com/elastic/integrations/pull/19254))Doc update. Clarify expected metrics format and explicitly calling out that Prometheus format is not supported. | 9.3.0 |
| **1.2.1** | **Bug fix** ([View pull request](https://github.com/elastic/integrations/pull/19049))Document setting data_stream.dataset to collectortelemetry and fix queries for TBS dashboards. | 9.3.0 |
| **1.2.0** | **Enhancement** ([View pull request](https://github.com/elastic/integrations/pull/18527))Add tailsamplingprocessor specific visualizations and dashboards. | 9.3.0 |
| **1.1.0** | **Enhancement** ([View pull request](https://github.com/elastic/integrations/pull/18048))Add alerting rules for failed span, metric point and log record exports. | 9.3.0 |
| **1.0.0** | **Enhancement** ([View pull request](https://github.com/elastic/integrations/pull/18046))Add ES|QL based dashboards and increase minimum Kibana version to 9.3. | 9.3.0 |
| **0.1.0** | **Enhancement** ([View pull request](https://github.com/elastic/integrations/pull/17774))Add lens based dashboards for older Kibana versions (8.19+). | 8.19.0 |
| **0.0.4** | **Enhancement** ([View pull request](https://github.com/elastic/integrations/pull/17526))Separate dashboards per event type and adding more dropdowns to filter by receiver, exporter, processor and more. | 9.3.0 |
| **0.0.3** | **Enhancement** ([View pull request](https://github.com/elastic/integrations/pull/17248))Extend docs | |
| **0.0.2** | **Enhancement** ([View pull request](https://github.com/elastic/integrations/pull/17199))Use SVG for icon | |
| **0.0.1** | **Enhancement** ([View pull request](https://github.com/elastic/integrations/pull/16305))Adding visualizations for OpenTelemetry Collector internal telemetry including CPU, memory, usage, queue size, failed and exported spans, metrics, traces. | |