Elastic Cloud Integration
| Version | 1.0.0 (View all) |
| Subscription level What's this? |
Platinum |
| Developed by What's this? |
Elastic |
| Minimum Kibana version(s) | 9.6.0 |
The Elastic Cloud integration adds Elasticsearch mappings, an ingest pipeline, Kibana dashboards, and alerting rules for audit trail log delivery. The first data stream is Serverless audit logs. This package does not collect data with Elastic Agent.
Audit trail delivery writes project-level Elasticsearch and Kibana audit events to logs-elastic_cloud.serverless_audit.otel-* on an Elastic Security Serverless or Elastic Observability Serverless destination. The destination can be the same project as the source. You can read more about enablement, ignore filters, and example queries in Audit trail log delivery.
This integration requires Kibana 9.6.0 or later.
- Serverless audit: project-level Elasticsearch and Kibana audit events delivered by Elastic Cloud Serverless.
The ingest pipeline copies the forwarded client IP to client.ip and adds GeoIP. If the lookup fails, the error is stored in error.message.
- An Elastic Security Serverless or Elastic Observability Serverless project as the destination
- Audit trail log delivery enabled on the source project
The package assets are already installed on the destination project. There is no Elastic Agent policy to configure.
This integration does not use Elastic Agent. Do not add it to an agent policy.
In Kibana on the destination project, open Dashboards and then [Audit] Command Center. Generate audit activity on the source project, such as signing in to Kibana or editing a dashboard, then confirm the panels on the destination populate.
This integration installs:
- Index templates for
logs-elastic_cloud.serverless_audit.otel-* - An ingest pipeline for the
elastic_cloud.serverless_auditdata stream - Field mappings for the GeoIP enrichment of
client.ip - The [Audit] dashboards, saved searches, and visualizations
- Alerting rule templates for sign-in and location anomalies
The package installs the rule templates with its other assets. Add a rule from the Elastic Cloud integration Assets tab before it alerts.
Each rule reads logs-elastic_cloud.serverless_audit.otel-*. A sign-in success is an Elasticsearch authentication_success or a Kibana user_login. The identity is the email, otherwise the API key name, otherwise the user name. A Cloud API key stays distinct by realm. Platform accounts (elastic/kibana, elastic/fleet-server, elastic.maintenance, autoscaling, and elasticsearch-controller) are excluded.
- [Elastic Cloud] Password guessing: one identity fails to sign in at least 15 times in 10 minutes.
- [Elastic Cloud] Password spray: one client IP fails against at least 10 identities in 15 minutes.
- [Elastic Cloud] Credential stuffing: at least 30 failures, 10 identities, and 5 public IPs in 10 minutes.
- [Elastic Cloud] Successful sign-in after repeated failures: at least 5 failures, then a success, in 30 minutes.
- [Elastic Cloud] Impossible travel: two geolocated sign-ins at least 500 km apart, faster than 800 km/h or at the same moment, within 6 hours.
- [Elastic Cloud] Sign-in from a new country: a known identity uses a country it has not used in the last 7 days.
- [Elastic Cloud] First-seen identity sign-in: the first sign-in in 7 days. This rule stays quiet until the audit stream is at least 24 hours old.
- [Elastic Cloud] Credential used from many places: two countries in one hour, or an API key used from 3 public IPs.
Private, link-local, and carrier-NAT addresses are left out of the location rules, because those addresses do not geolocate.
No events in the dashboards
- Make sure audit trail log delivery is enabled and sending to this destination project. See Audit trail log delivery.
- Make sure documents are written to
logs-elastic_cloud.serverless_audit.otel-*.
Missing GeoIP fields
Private and documentation-range addresses do not resolve. If the lookup fails, the error is stored in error.message.
The serverless_audit data stream stores one audit event per document. The package adds client.ip, client.geo.*, and error.message. Other audit fields are mapped by the built-in OpenTelemetry templates.
Exported fields
| Field | Description | Type |
|---|---|---|
| @timestamp | Date/time when the event originated. This is the date/time extracted from the event, typically representing when the event was generated by the source. If the event source has no original timestamp, this value is typically populated by the first time the event was received by the pipeline. Required field for all events. | date |
| client.geo.city_name | City name. | keyword |
| client.geo.continent_name | Name of the continent. | keyword |
| client.geo.country_iso_code | Country ISO code. | keyword |
| client.geo.country_name | Country name. | keyword |
| client.geo.location | Longitude and latitude. | geo_point |
| client.geo.region_iso_code | Region ISO code. | keyword |
| client.geo.region_name | Region name. | keyword |
| client.ip | IP address of the client (IPv4 or IPv6). | ip |
| data_stream.dataset | The field can contain anything that makes sense to signify the source of the data. Examples include nginx.access, prometheus, endpoint etc. For data streams that otherwise fit, but that do not have dataset set we use the value "generic" for the dataset value. event.dataset should have the same value as data_stream.dataset. Beyond the Elasticsearch data stream naming criteria noted above, the dataset value has additional restrictions: * Must not contain - * No longer than 100 characters |
constant_keyword |
| data_stream.namespace | A user defined namespace. Namespaces are useful to allow grouping of data. Many users already organize their indices this way, and the data stream naming scheme now provides this best practice as a default. Many users will populate this field with default. If no value is used, it falls back to default. Beyond the Elasticsearch index naming criteria noted above, namespace value has the additional restrictions: * Must not contain - * No longer than 100 characters |
constant_keyword |
| data_stream.type | An overarching type for the data stream. Currently allowed values are "logs" and "metrics". We expect to also add "traces" and "synthetics" in the near future. | constant_keyword |
| error.message | Error message. | match_only_text |
| event.kind | This is one of four ECS Categorization Fields, and indicates the highest level in the ECS category hierarchy. event.kind gives high-level information about what type of information the event contains, without being specific to the contents of the event. For example, values of this field distinguish alert events from metric events. The value of this field can be used to inform how these kinds of events should be handled. They may warrant different retention, different access control, it may also help understand whether the data is coming in at a regular interval or not. |
keyword |
This package has no Elastic Agent inputs.
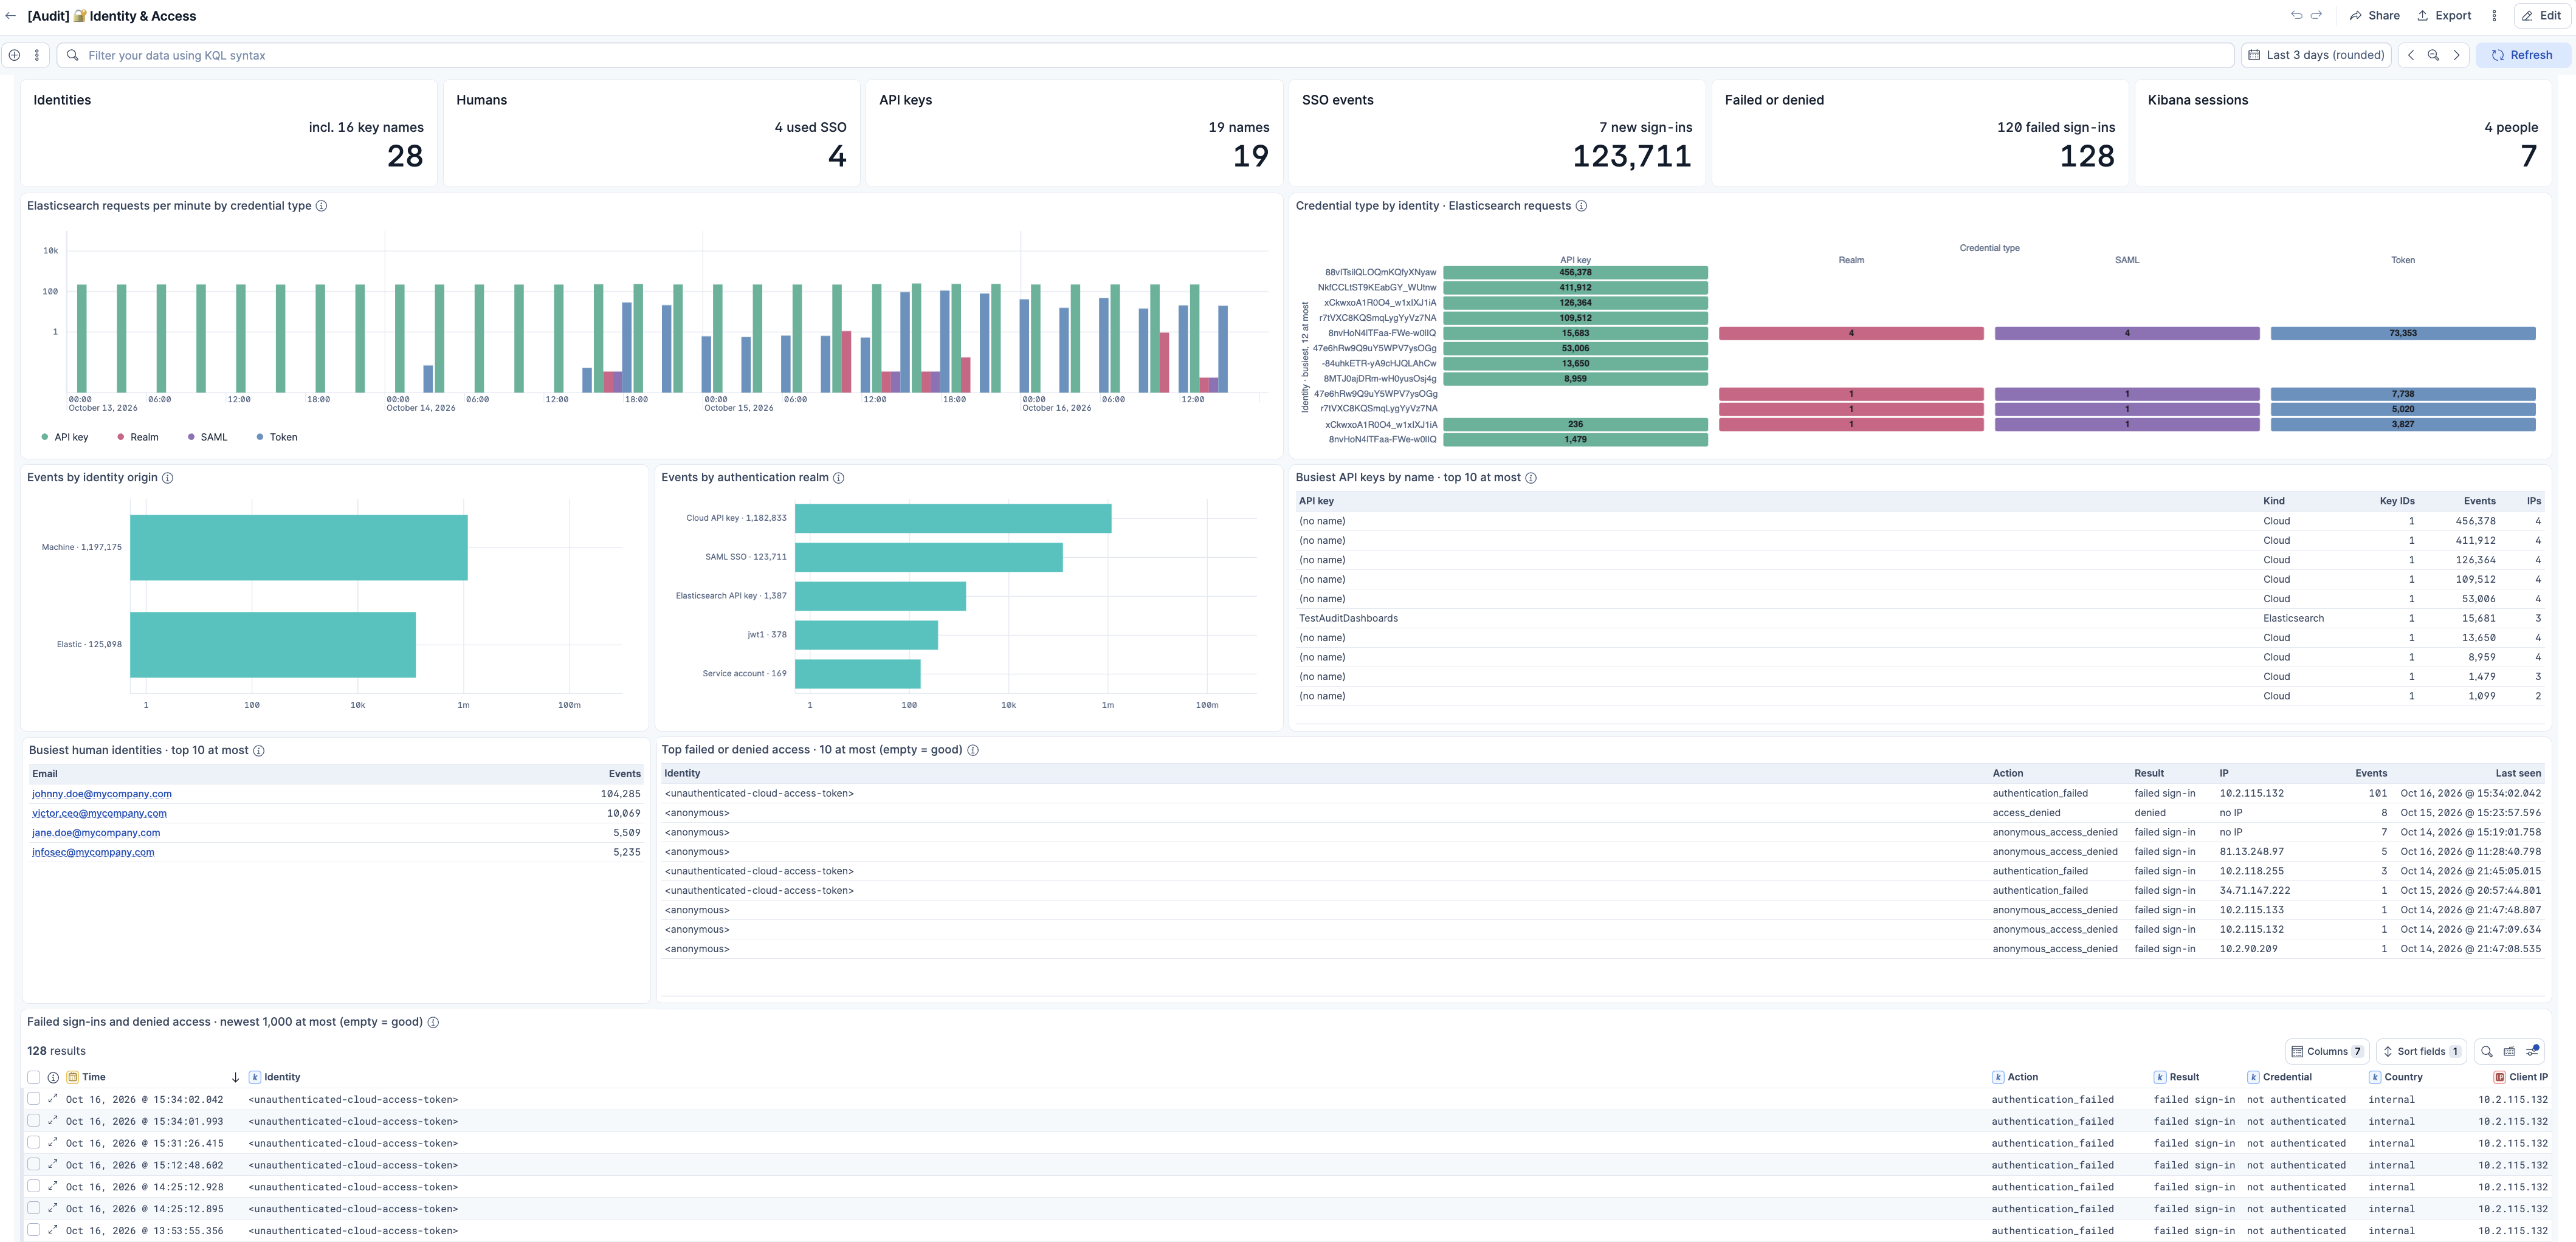
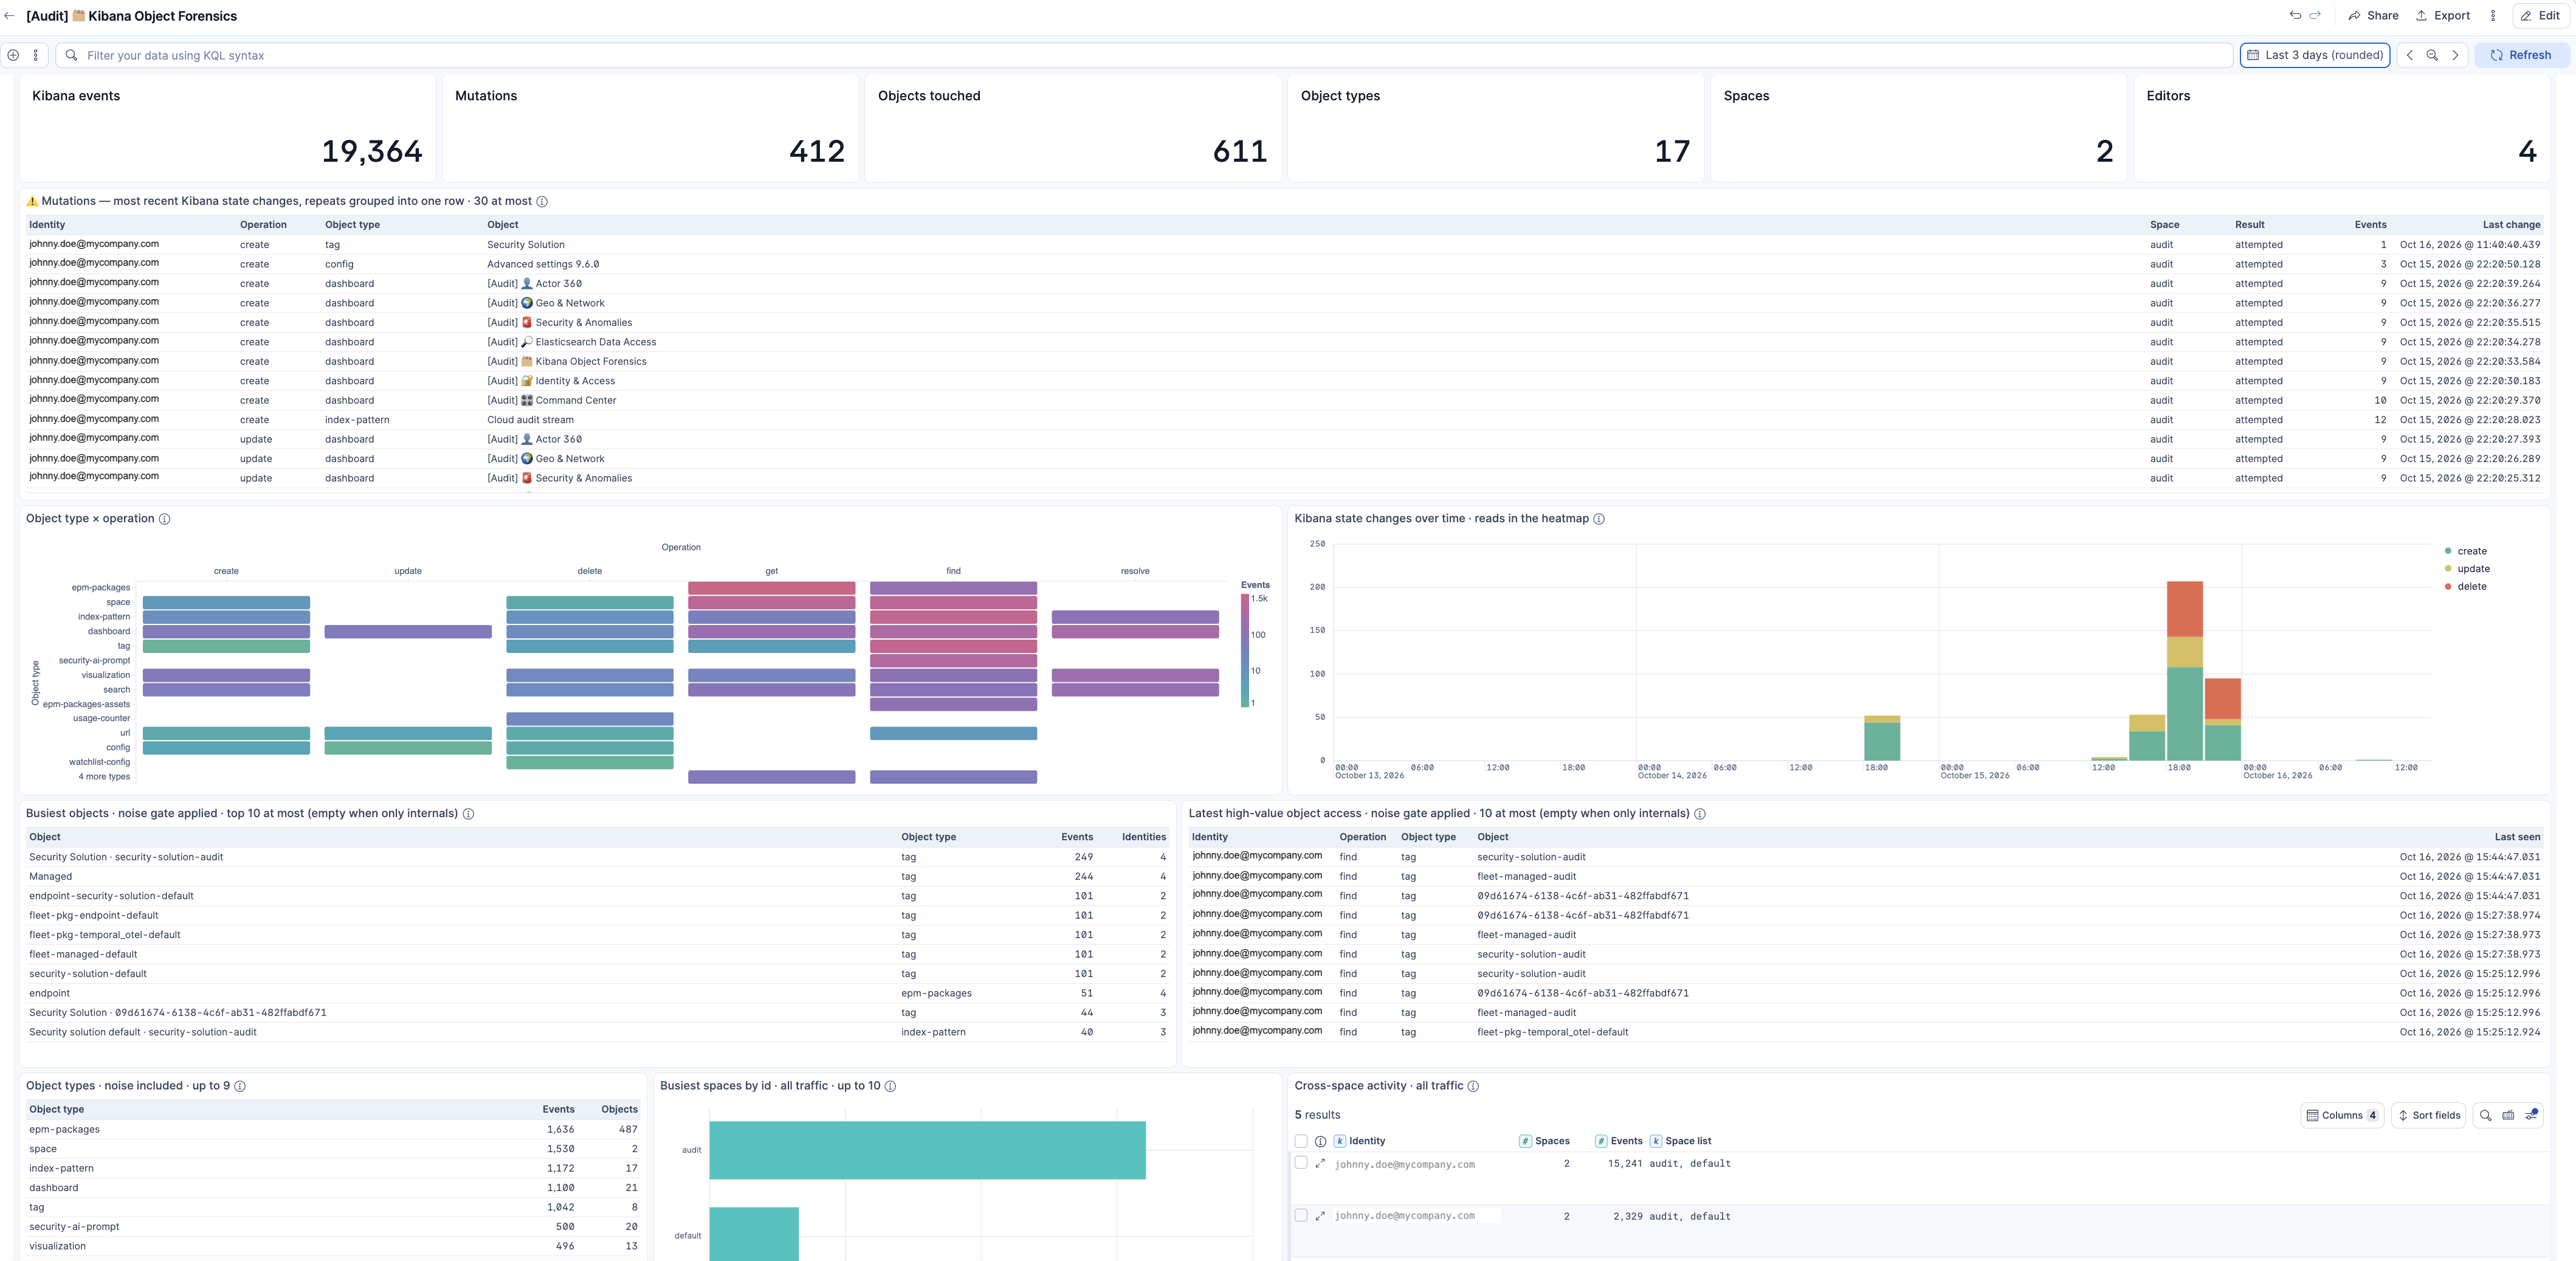
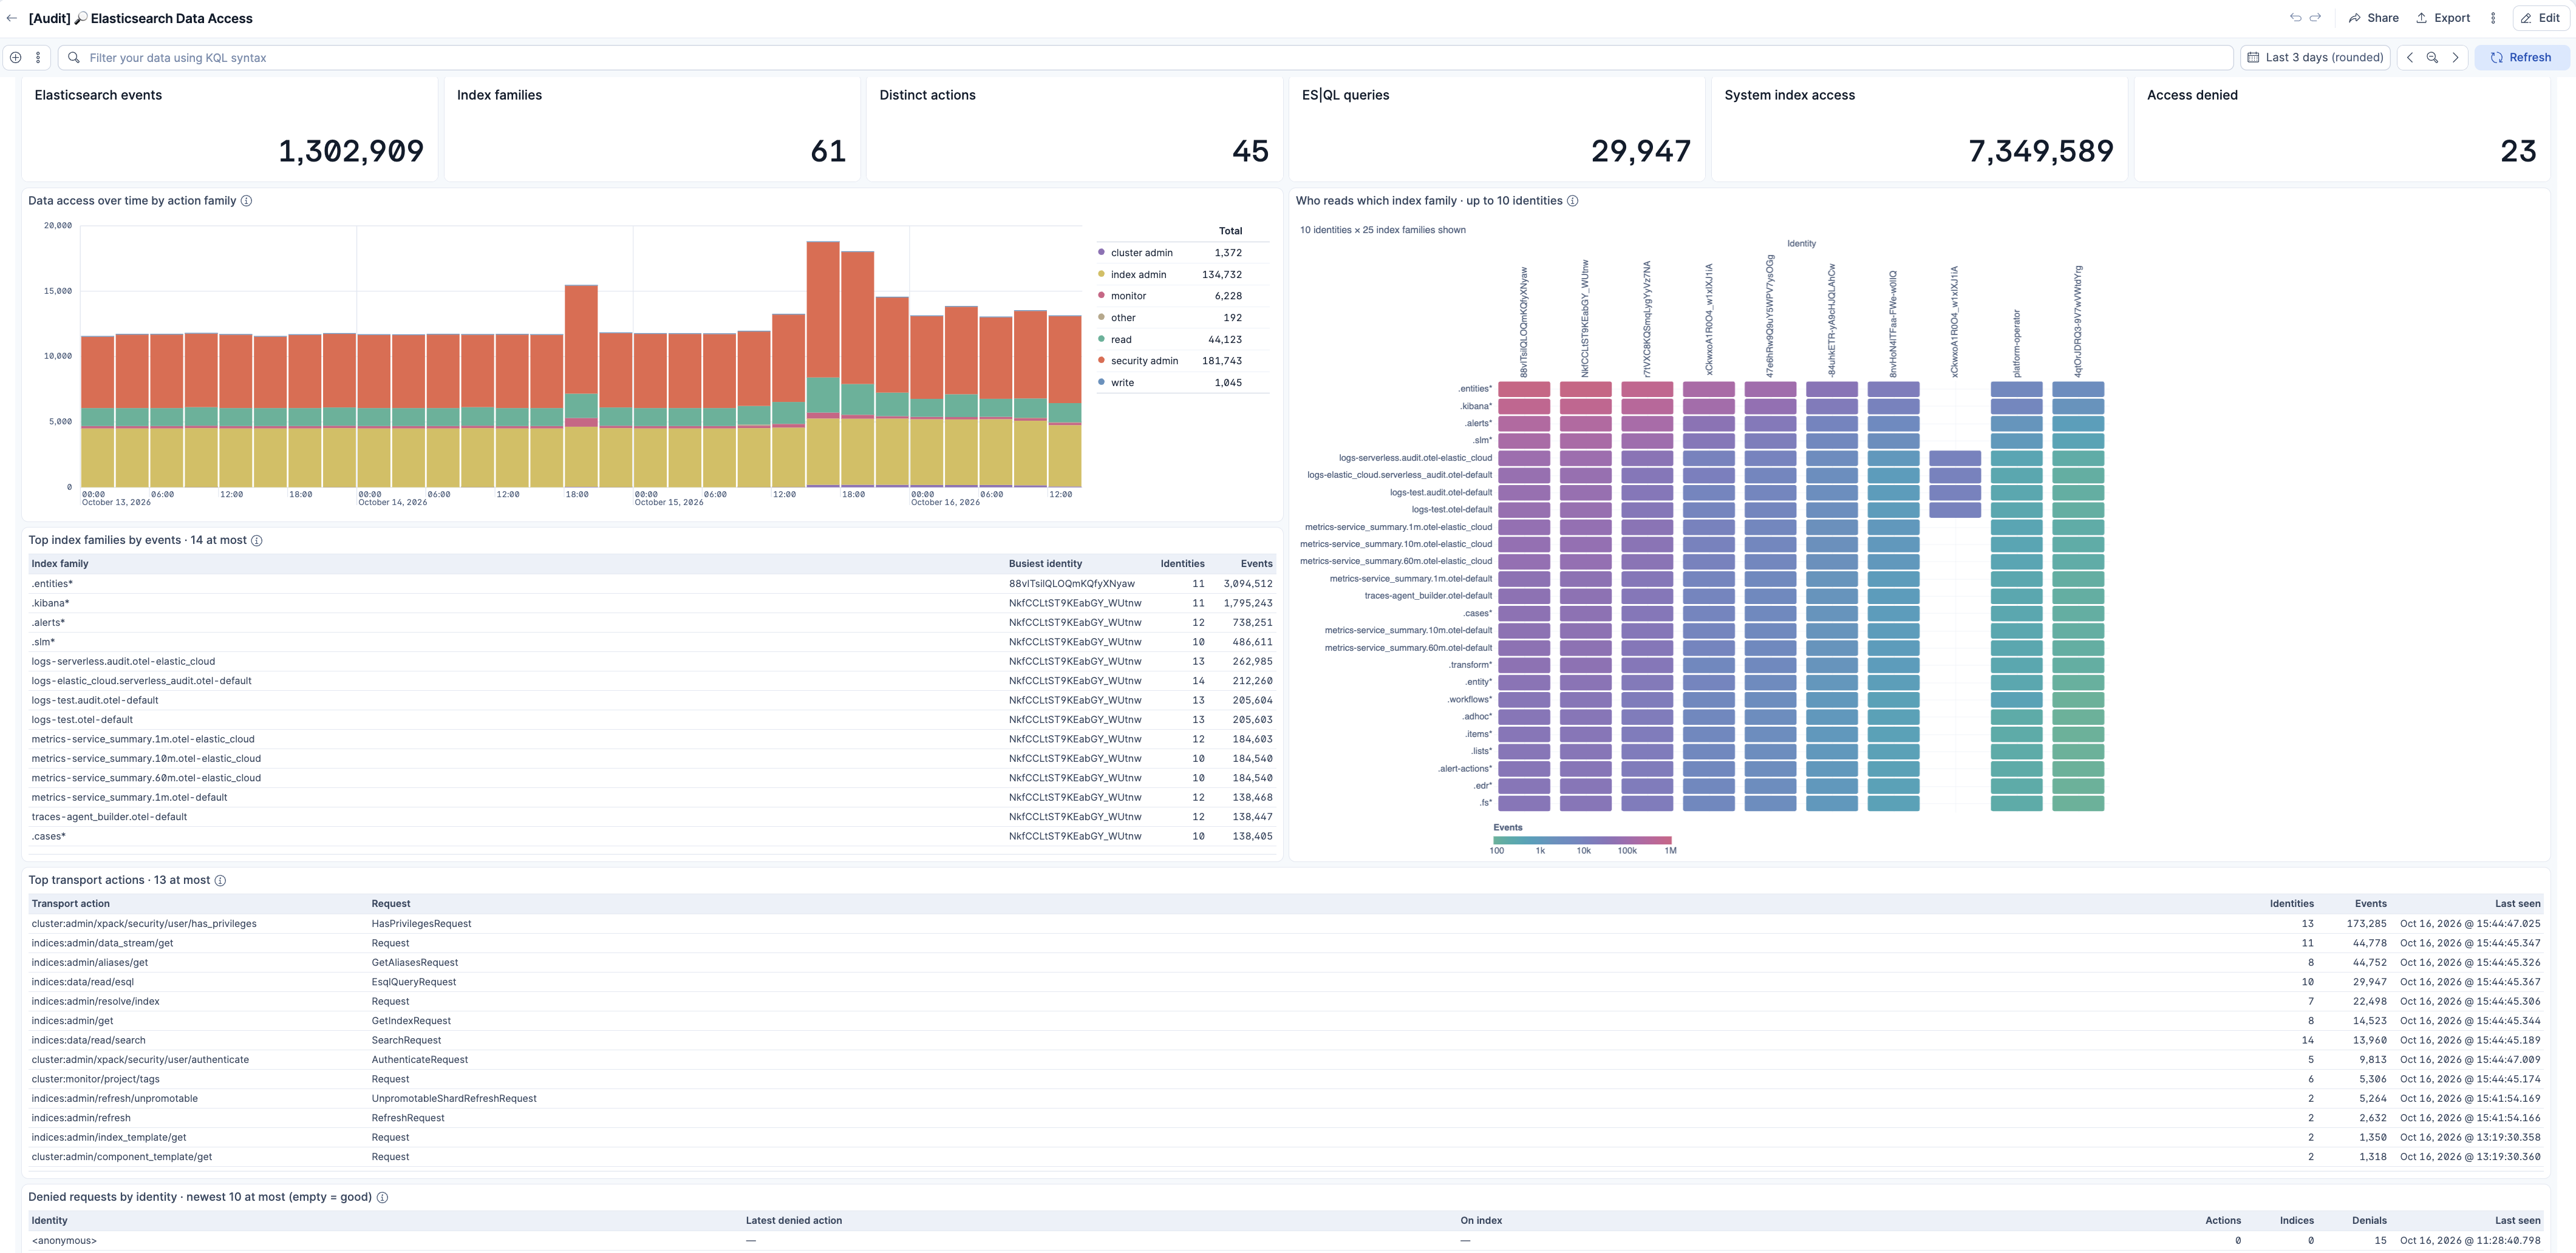
This integration includes one or more Kibana dashboards that visualizes the data collected by the integration. The screenshots below illustrate how the ingested data is displayed.
Changelog
| Version | Details | Minimum Kibana version |
|---|---|---|
| 1.0.0 | Enhancement (View pull request) Promote the Elastic Cloud integration to GA. |
9.6.0 |
| 0.1.4 | Enhancement (View pull request) Add alerting rules for password guessing, password spray, credential stuffing, a successful sign-in after repeated failures, impossible travel, a new country, a first-seen identity, and a credential used from many places, count Kibana user_login successes, ignore link-local and IPv6 unique-local addresses, tighten the sign-in, spray, and impossible-travel queries, document those rules in the README, and rename the Identity 360 dashboard asset to elastic_cloud-audit-identity-360. |
9.6.0 |
| 0.1.3 | Enhancement (View pull request) Add audit dashboard screenshots, rename Actor 360 to Identity 360, correct unusual-hour counts, travel lines, private-address labels, denied reads, and the cohort highlight, replace em dashes with hyphens in the audit dashboards, Discover sessions, and charts, and shorten the README so enablement and example queries stay in the audit trail documentation. |
9.6.0 |
| 0.1.2 | Enhancement (View pull request) Nullify unmapped api_key fields in Kibana queries and replace the audit logs search with an unfiltered event list. |
9.6.0 |
| 0.1.1 | Enhancement (View pull request) Query Kibana assets with ECS field names and add an audit logs saved search. |
— |
| 0.1.0 | Enhancement (View pull request) Initial release of the Elastic Cloud integration with an assets-only serverless audit data stream. |
— |