Explore fields in Discover
When you open Discover on data you don't know yet, the fields list in the sidebar shows what that data contains. From there, you can look at a field's details, split the chart by it, or put it in the results table as a column. In classic mode, the details include the field's most frequent values.
Open Discover and run a query that returns results. In ES|QL mode, run a query first. Refer to Get started with ES|QL in Discover. In classic mode, select a data view and a time range first. Refer to Select a data view and a time range.
In the sidebar, check the available fields in the fields list. It's common to have hundreds of fields. Use the search at the top of the sidebar to look for specific terms in the field names. For example, enter
main the search field to find themanufacturerfield.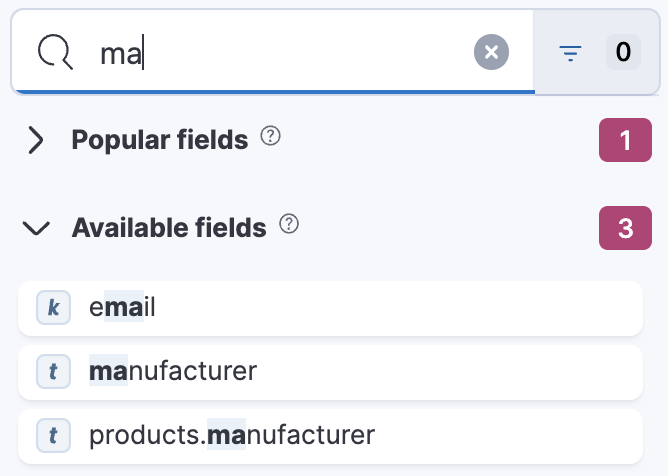 Tip
You can combine multiple keywords or characters. For example,
geo destfindsgeo.destandgeo.src.dest.When you explore logs data in the Observability solution view, the fields list starts with a Recommended fields group. It holds fields that are most useful for logs, such as log.level,service.name, andhost.name.Select a field name to open its details. In classic mode, Discover shows the field's top 10 values and the number of records used to calculate them. In ES|QL mode, the field details don't include top values. To see the most frequent values of a field, run a query such as
STATS COUNT(*) BY <field>.To split the chart by that field, select Add breakdown in the field details. In ES|QL mode, this works only when the data source has a time field and your query doesn't reshape the results with a command such as
STATSorKEEP.Next to a field in the fields list, select to add it to the results table as a column. You can also drag the field from the list into the table.
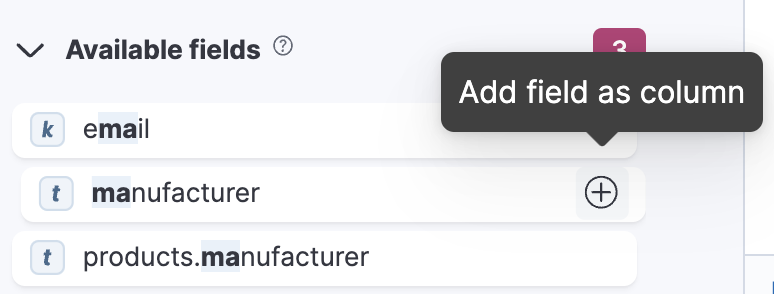
When you add fields to the table, the Summary column is replaced. For ES|QL-specific details about the time field and CSV exports, refer to Show specific columns in the results table.
To keep the Summary column next to the fields you add, turn on Pin summary in the Columns menu. In JSON view, adding fields limits the tree to those fields. Refer to View documents as JSON. 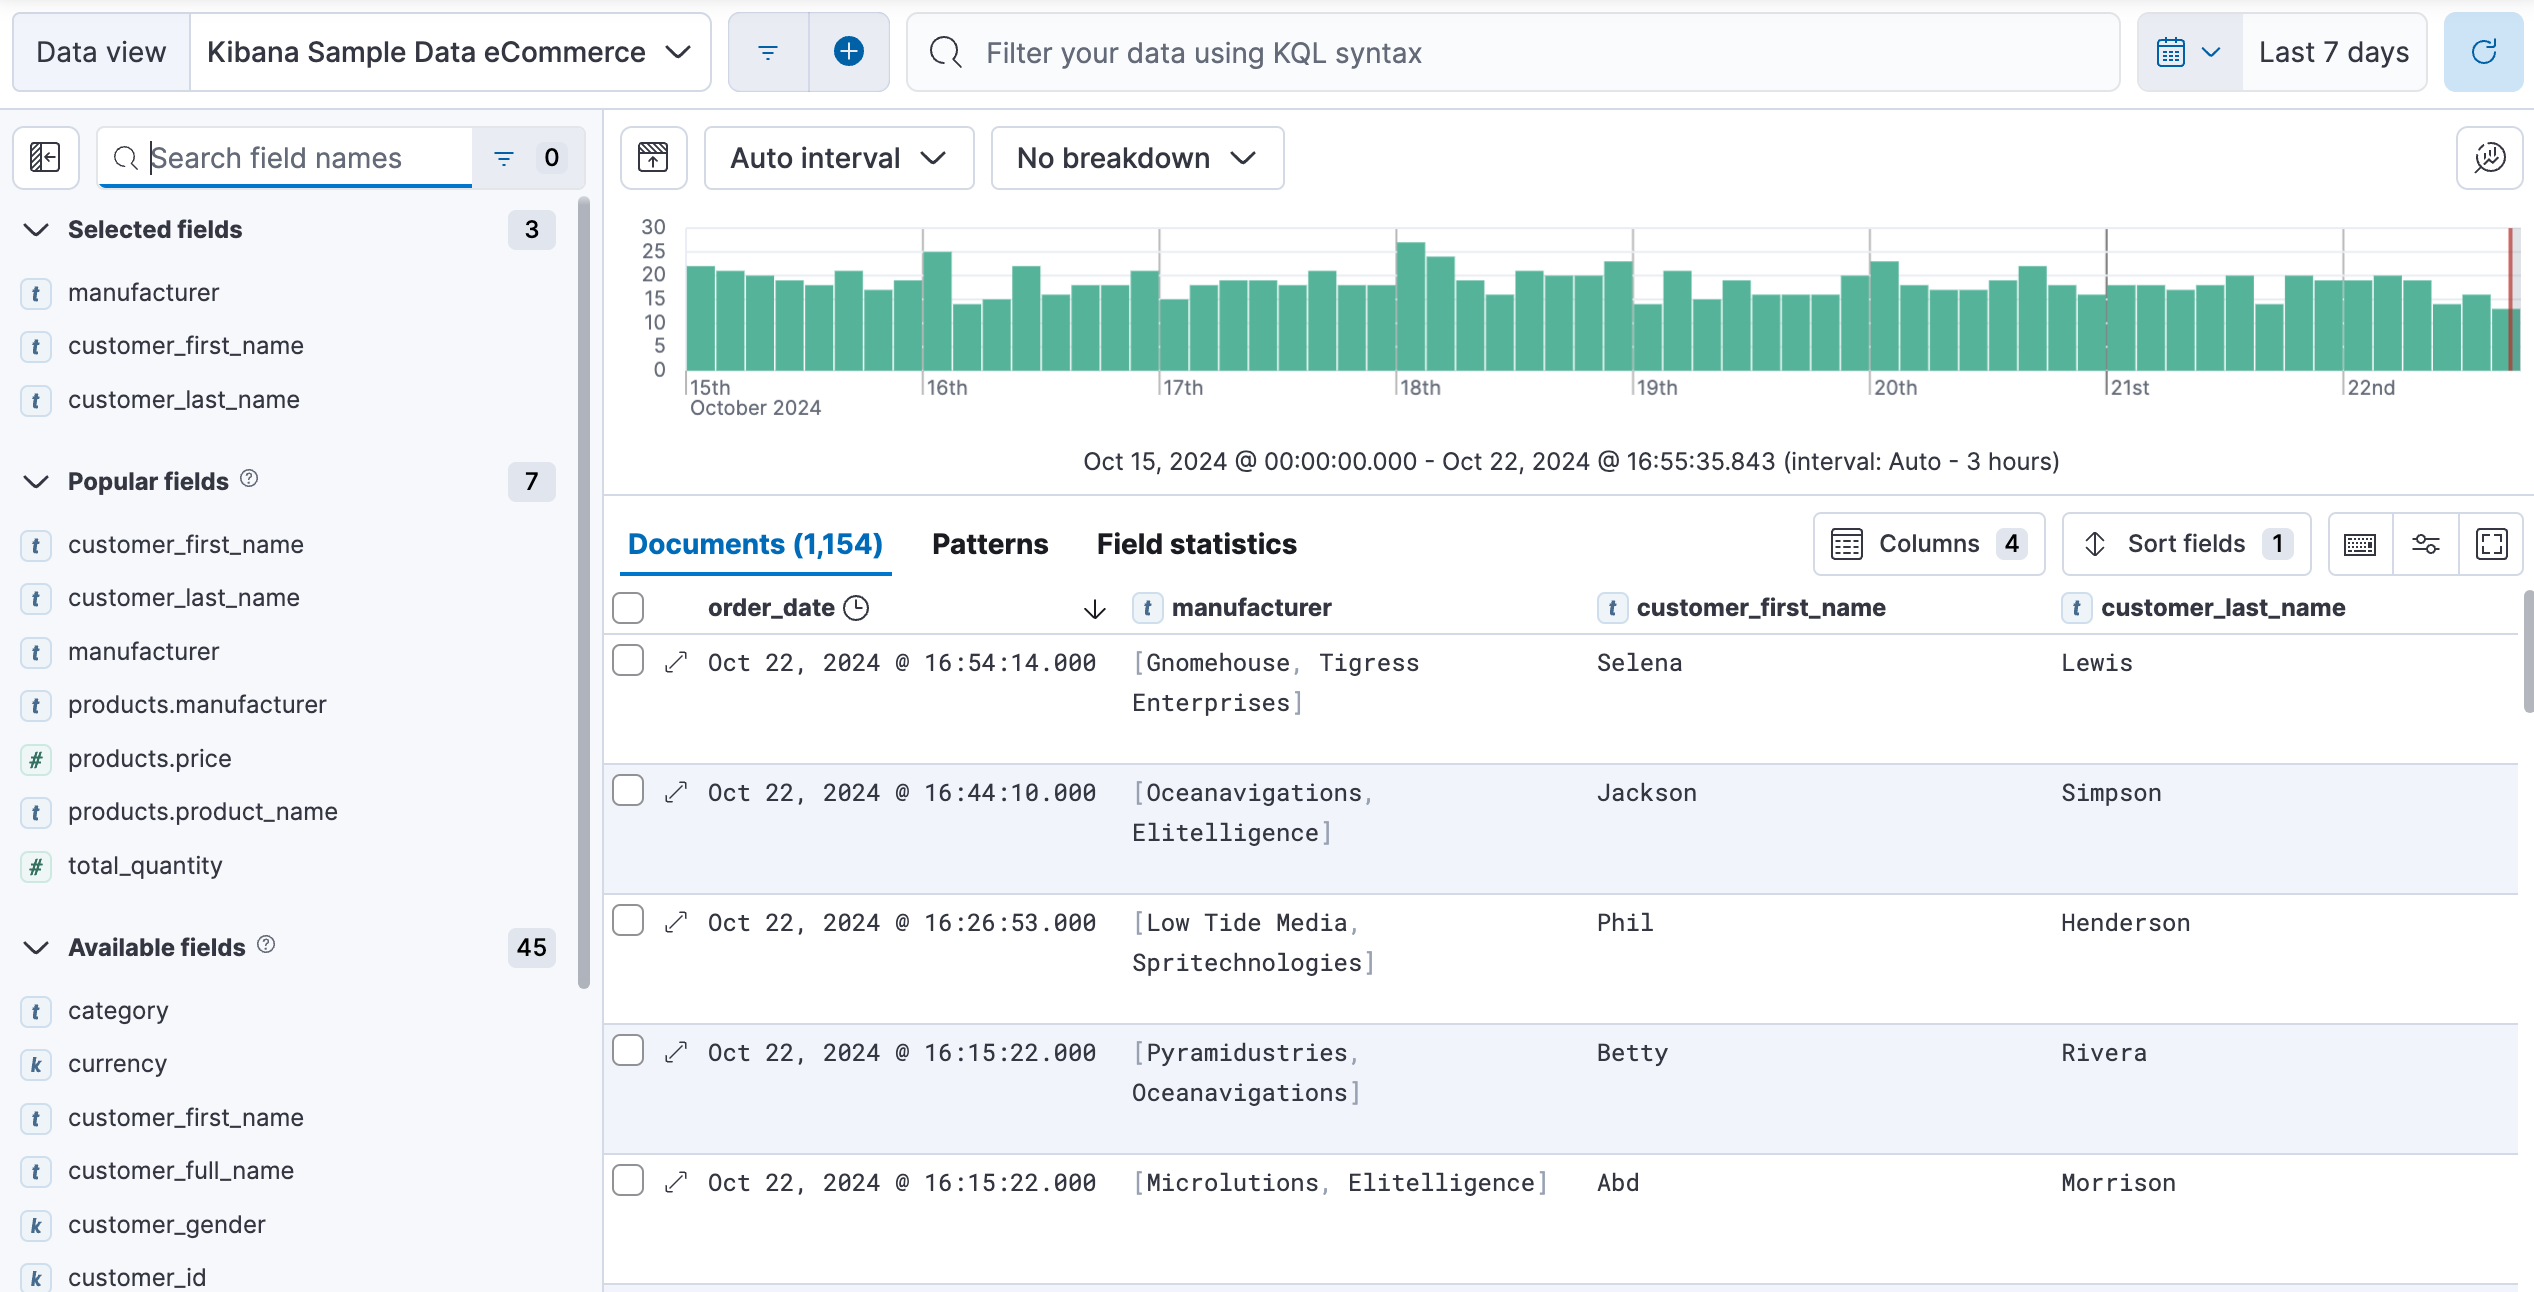
Optional: To keep the fields you care about in view, resize or reorder columns, expand the table to full screen, or collapse the chart and the fields list. Refer to Customize the Discover view for all options.
Optional: To reopen this view later, save your work as a Discover session.
Result: You can see what your data contains, and the table shows the fields you added as columns.
- To chart a field in classic mode, refer to Visualize a field from Discover.
- To read every field of a single result, refer to Inspect documents and requests in Discover.