Visualize a field from Discover
When a field in the fields list looks interesting, you can open it in Lens to see how its values break down, without building a chart from scratch. Lens is the default visualization editor in Kibana.
- Make sure Discover is in classic mode. ES|QL mode doesn't support this functionality. To switch, refer to Switch to Discover's classic mode.
- Discover must have a data view selected, and a search must have run on a time range that contains data, so the fields list appears.
- This example uses the ecommerce sample data. To follow along, add it and select its data view.
In the fields list in the sidebar, find a field that can be aggregated, for example
day_of_weekin the ecommerce sample data. Select the field name to open its details.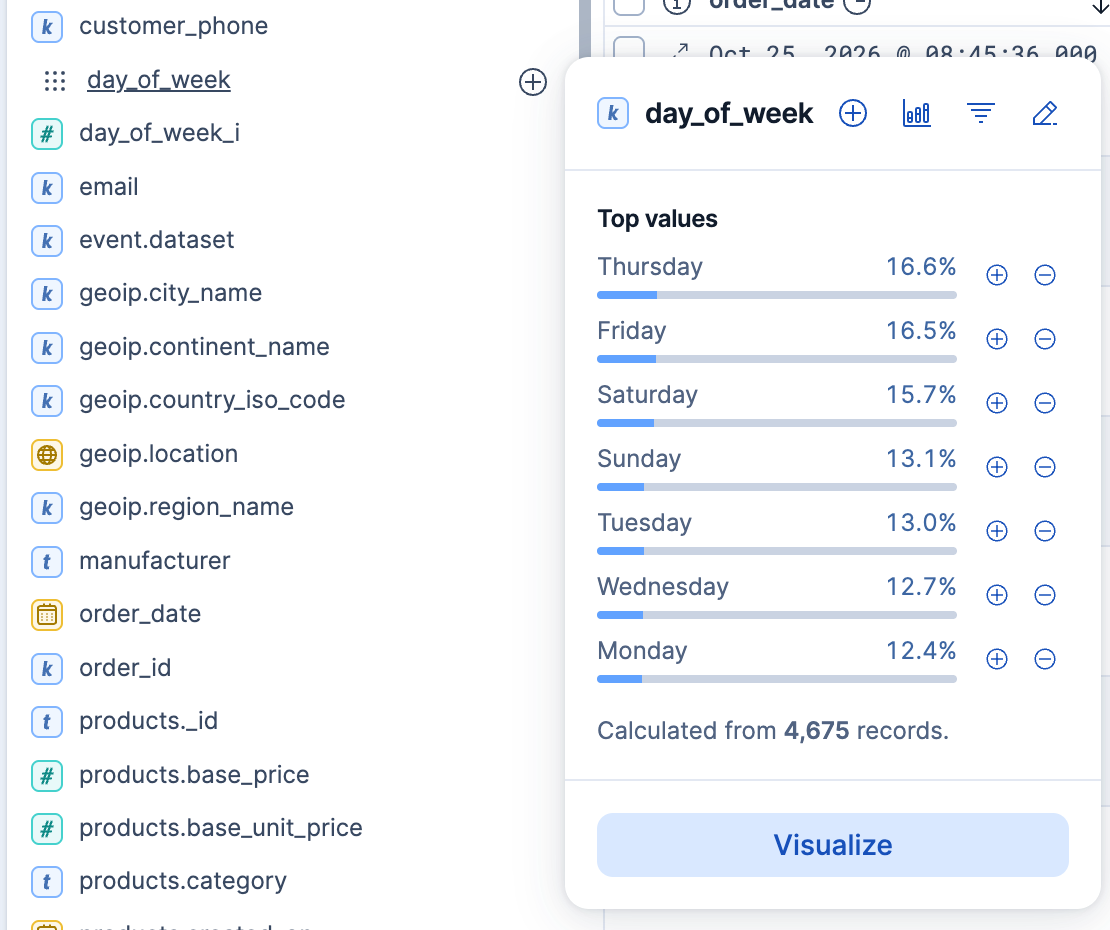
In the field details, select Visualize.
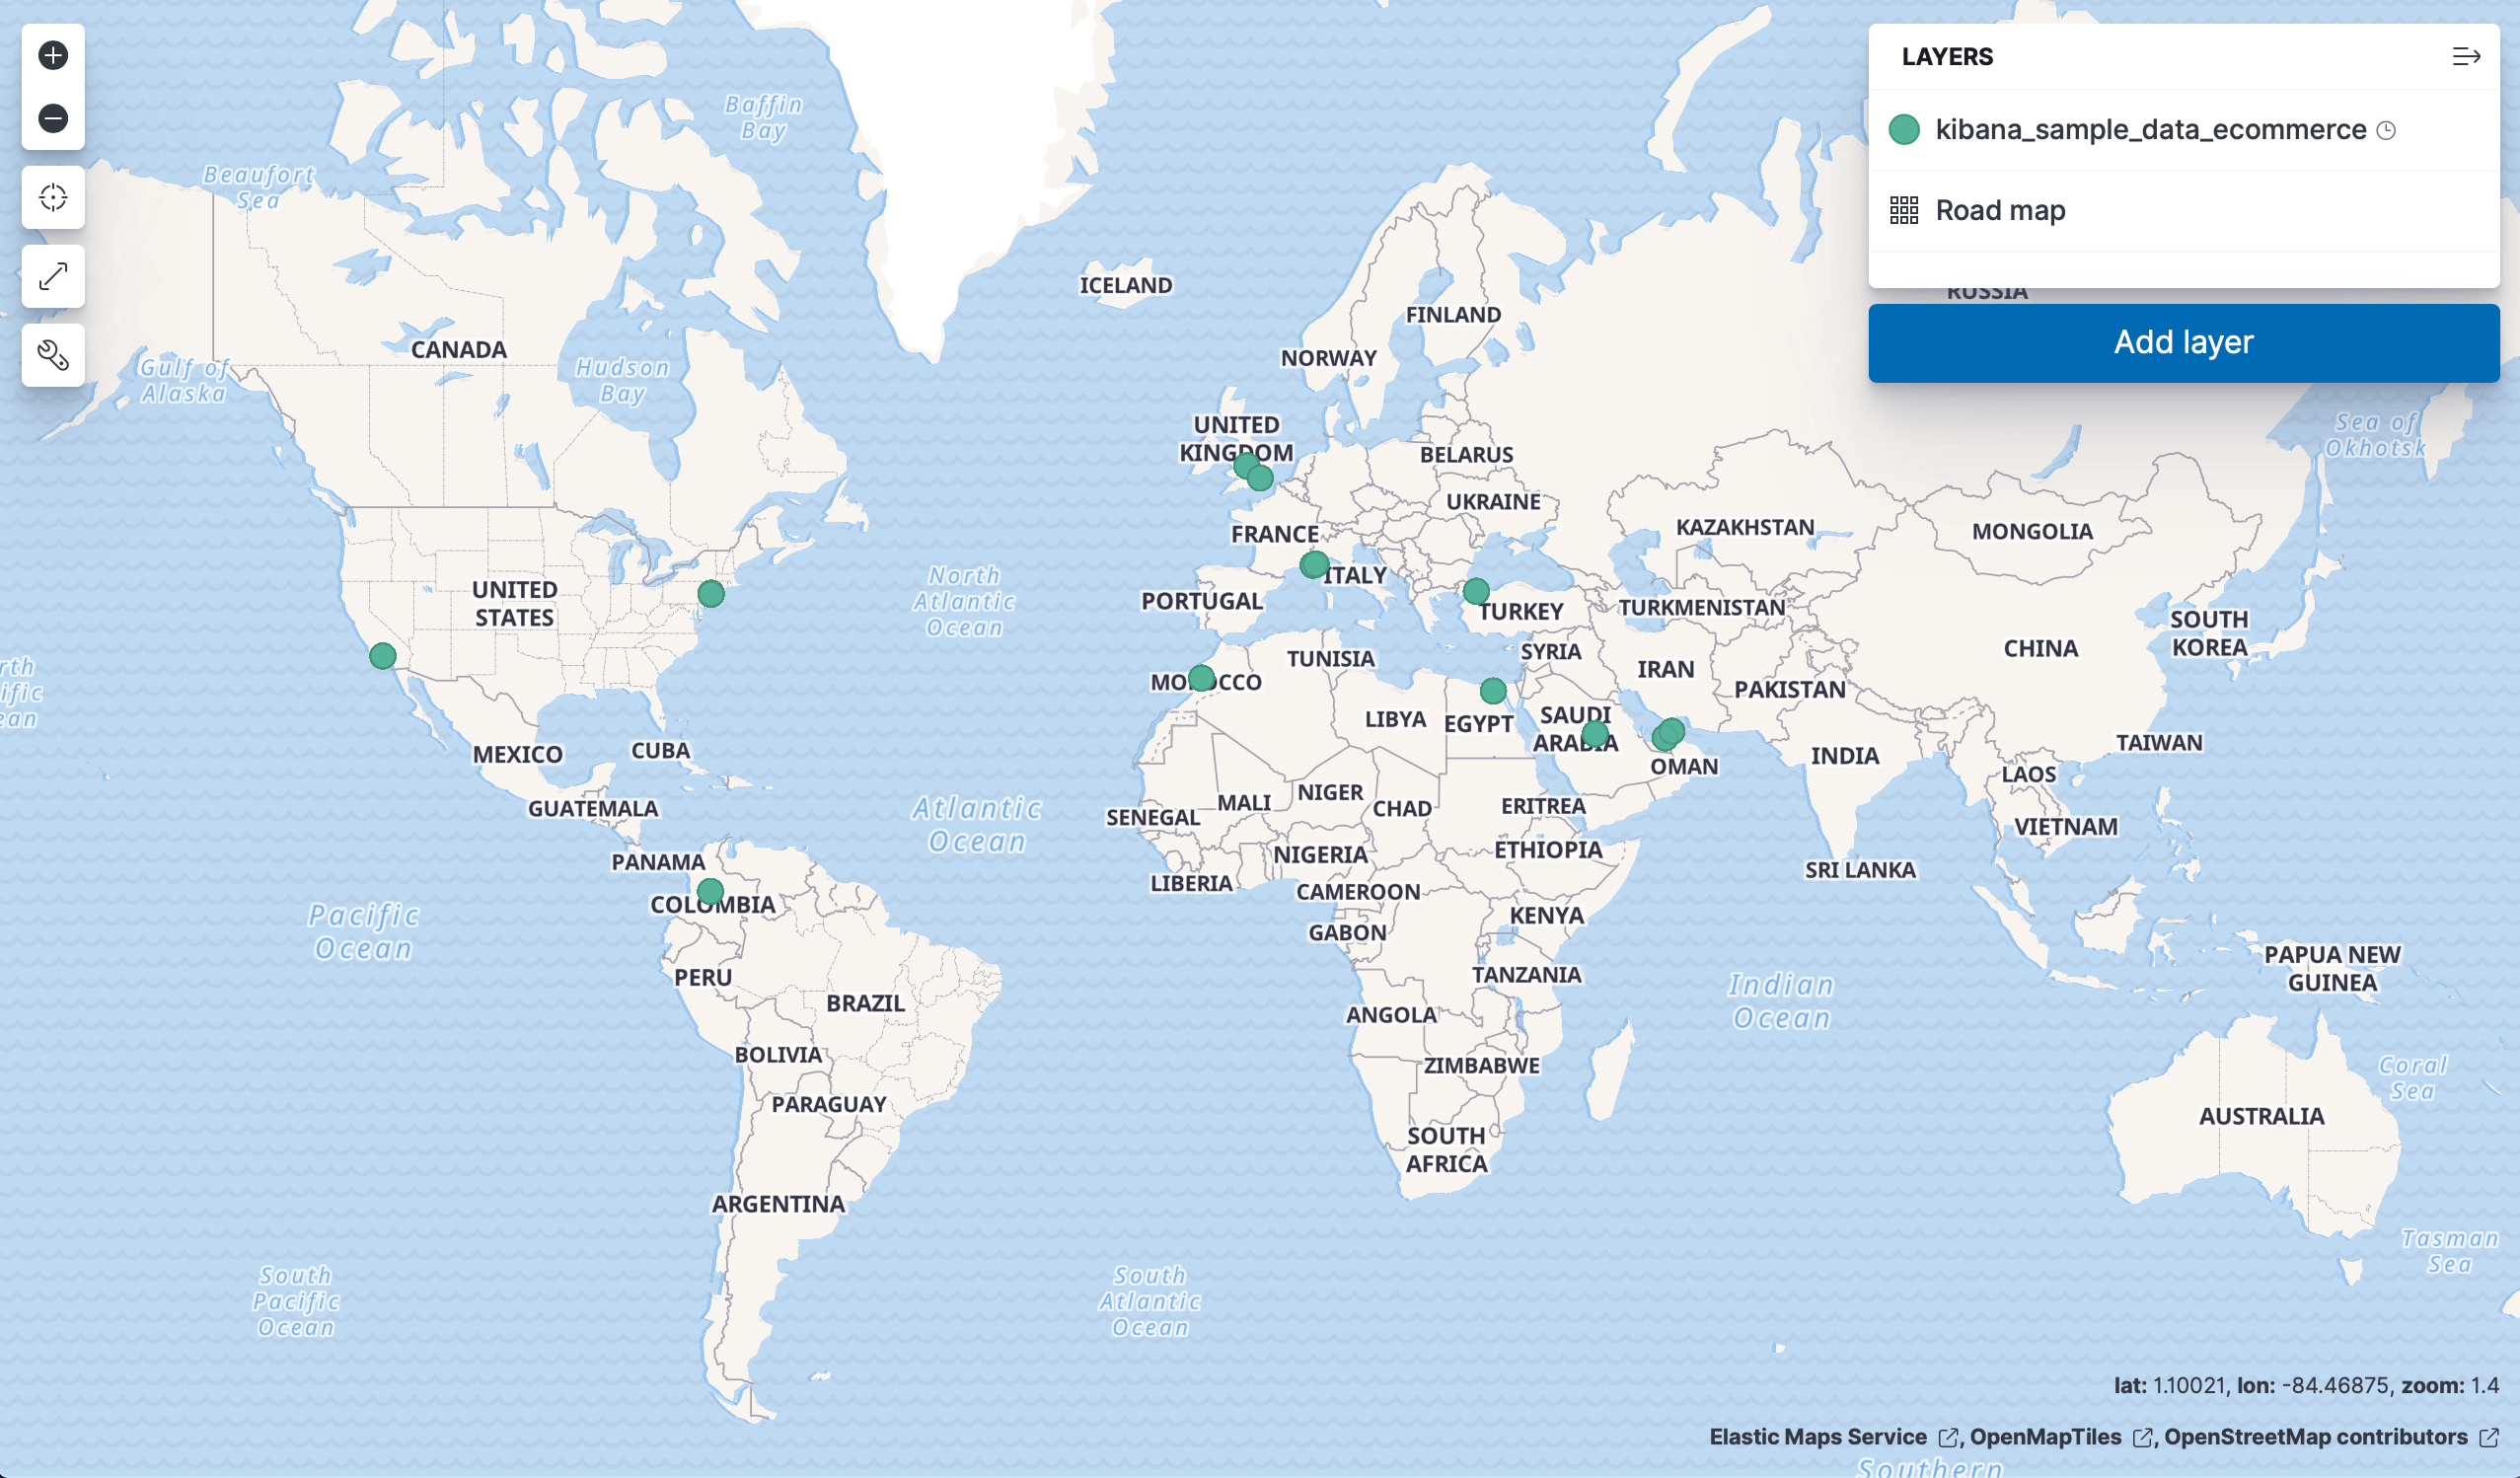
Kibana creates a Lens visualization best suited for this field. For geo point fields (
 ), your data appears on a map instead.
Optional: In Lens, from the Available fields list, drag more fields onto the chart to refine the visualization. In this example, adding the
manufacturer.keywordfield automatically adds a breakdown of the top values to the visualization.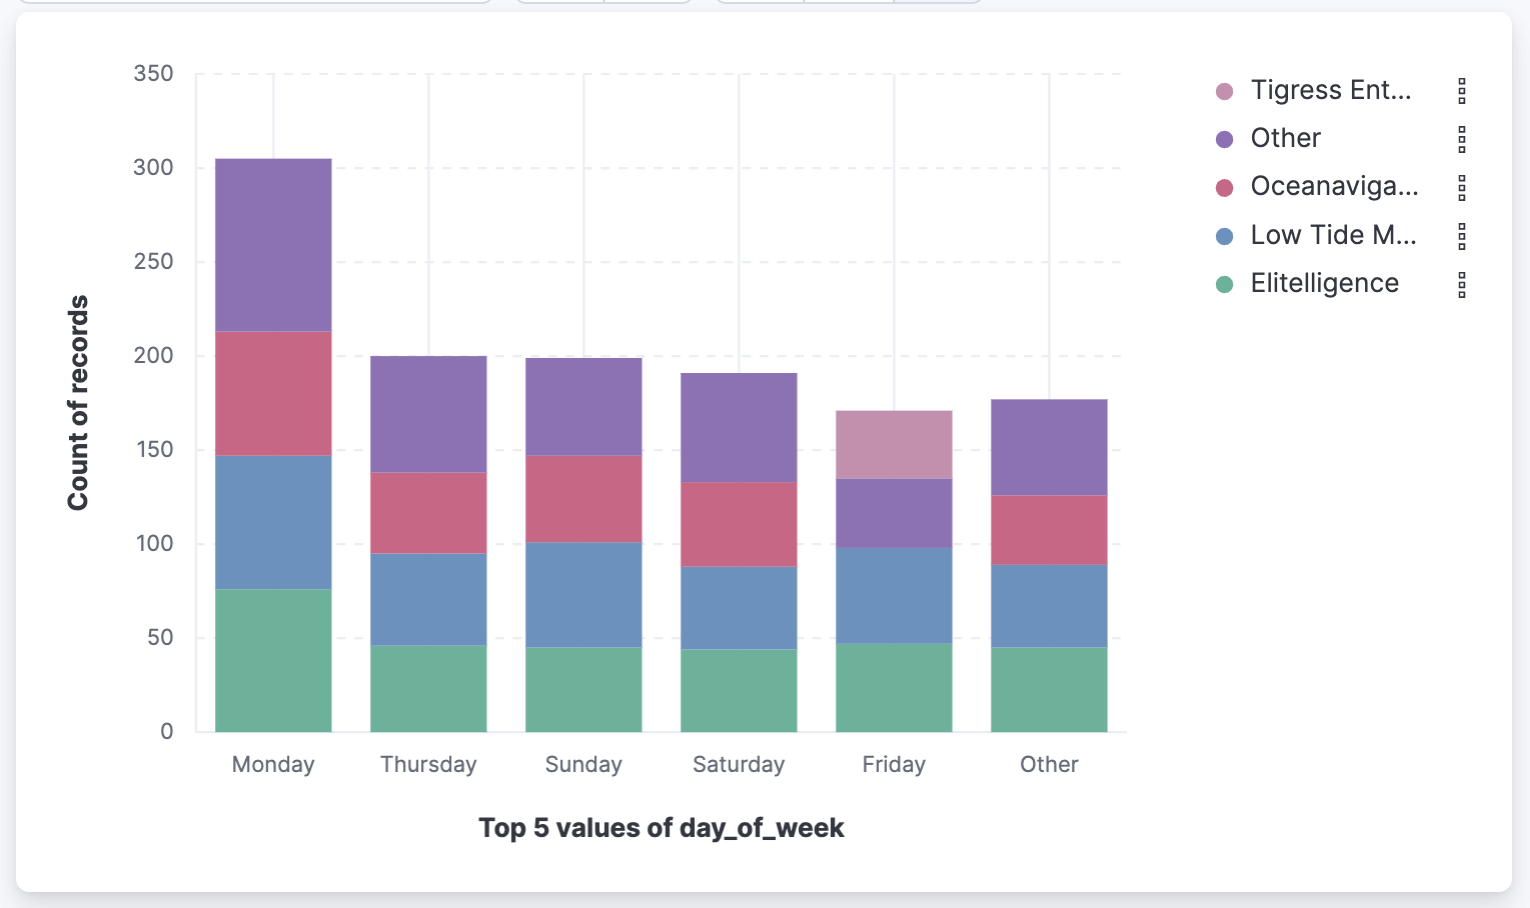
To keep the visualization, select Save. In the save dialog, you can add the visualization to a dashboard, save it to the Visualize library, or both.
Result: You have a visualization of the field that you can refine in Lens, add to a dashboard, or reopen from the Visualize library.
- To check a field's values before you chart it, refer to Explore fields in Discover.